Migrate Multiple S3 Buckets in Parallel
Migrate multiple S3 buckets in parallel using one Godwit config file per pair, a short orchestrator script, and a single Grafana dashboard showing all runs.
Once you know how to migrate one S3 bucket, the next problem is migrating 5 or 20 at once: one Godwit Sync config file per bucket pair, a short Python script that runs them all in parallel, and per-pair observability in a single Grafana dashboard.
Hands-on lab available: Run a 4-bucket parallel migration against two RustFS S3 endpoints in Docker, with Prometheus and Grafana pre-configured. Go to the lab
Each Bucket Pair Deserves Its Own Migration
A multi-bucket migration needs to handle bucket pairs that differ in credentials, rate limits, object count, and object size. One bucket might have millions of small files, another a few hundred multi-gigabyte objects, a third might sit behind a strict RPS limit, and a fourth might require cross-provider transfer. A bash loop over aws s3 sync or a set of rclone instances can move the bytes, but both re-list source and destination on every run instead of resuming from a local checkpoint. Neither tool lets you describe a complete transfer job -- source, destination, rate limits, parallelism, state path, metrics port -- in a single config file. You end up encoding that in wrapper scripts.
The right primitive is one run equals one bucket pair. Each run has its own state, its own resume point, its own metrics endpoint. To migrate multiple S3 buckets, you orchestrate N independent runs - not one run that tries to be N things. Orchestration belongs outside the sync tool, in a script you own.
One S3 Migration Config per Bucket Pair
Godwit Sync supports YAML config files via the -f flag, including ${ENV_VAR} expansion for credentials. Create one config per bucket pair and drop them in a folder:
migrations/
  app-data.yml
  ml-models.yml
  logs-archive.yml
  user-uploads.yml
Each file is a standard Godwit config. Here is app-data.yml from the companion lab:
source:
  url: "s3://prod-app-data"
  endpoint: "s3.us-east-1.amazonaws.com"
  access_key: "${AWS_SOURCE_ACCESS_KEY}"
  secret_key: "${AWS_SOURCE_SECRET_KEY}"

destination:
  url: "s3://backup-app-data"
  endpoint: "s3.us-east-1.amazonaws.com"
  access_key: "${AWS_DEST_ACCESS_KEY}"
  secret_key: "${AWS_DEST_SECRET_KEY}"

options:
  parallel: 16

rate_limit:
  read_bps: 209715200 # 200 MB/s

run:
  run_id: "app-data"
  state_path: "./state/app-data.db"

status:
  addr: ":9100"
  drain_timeout: 15

output:
  brief: true
Each file is self-contained: credentials, endpoints, parallelism, rate limits, state path, and metrics port. A cross-provider pair (say, AWS to an on-prem S3-compatible store) would use a different endpoint, secure: false, and lower read_bps -- but the structure is identical. Godwit expands ${...} variables at load time, so the files themselves contain no secrets. The full config schema is documented in the configuration reference.

The Parallel S3 Migration Script
The orchestrator enumerates every .yml file in the migrations folder, spawns one godwit sync -f <file> per pair in parallel, and collects exit codes. No custom YAML parsing, no env var resolution -- Godwit handles all of that natively.
This is a simplified version of the script. The full version with retry, verify, and status commands is in the companion lab.
#!/usr/bin/env python3
"""migrate-many.py -- fan out godwit sync across config files in a folder."""

import subprocess, sys
from concurrent.futures import ProcessPoolExecutor, as_completed
from pathlib import Path

def run_pair(config_path, action):
    cmd = ["godwit", "sync", "-f", str(config_path)]
    if action == "plan":
        cmd.append("--plan-only")
    elif action == "retry":
        cmd.append("--resume")
    result = subprocess.run(cmd)
    return config_path.stem, result.returncode

def main():
    folder = Path(sys.argv[1]) if len(sys.argv) > 1 else Path("migrations")
    action = sys.argv[2] if len(sys.argv) > 2 else "run"
    configs = sorted(folder.glob("*.yml"))

    if not configs:
        print(f"No .yml files found in {folder}")
        sys.exit(1)

    with ProcessPoolExecutor(max_workers=len(configs)) as pool:
        futures = {
            pool.submit(run_pair, cfg, action): cfg.stem
            for cfg in configs
        }
        failed = 0
        for future in as_completed(futures):
            name, rc = future.result()
            status = "OK" if rc == 0 else "FAIL"
            print(f"[{status:>4}] {name}")
            failed += rc != 0

    sys.exit(failed)

if __name__ == "__main__":
    main()
Plan first, then execute:
python3 migrate-many.py migrations/ plan
python3 migrate-many.py migrations/ run
Each pair runs as an independent godwit sync process with its own state database, run ID, and metrics port -- all defined in its config file. The script prints which pairs succeeded and which failed.
Handling Failures Without All-or-Nothing
Each godwit sync process maintains its own SQLite state database tracking every object: planned, transferred, verified, or failed. A failure in one process does not touch another process's state.
To retry a failed pair, re-run the script with the retry action. The script passes --resume, which tells Godwit to skip planning and pick up from the last successful object. Resume works at the object level, not the bucket level. A fresh run plans and transfers from scratch; retry resumes where the previous attempt stopped.
For details on state tracking and checksum verification, see Verifying S3 Migrations. The companion lab extends this script with retry, verify, and status commands and walks through a failure-and-retry scenario step by step.
Observability: One Dashboard, Four Concurrent Runs
Each godwit sync process exposes Prometheus metrics on the port defined in its config file (status.addr). The four configs use ports 9100, 9101, 9102, 9103. Prometheus scrapes all four targets. A single Grafana dashboard shows every run side by side.
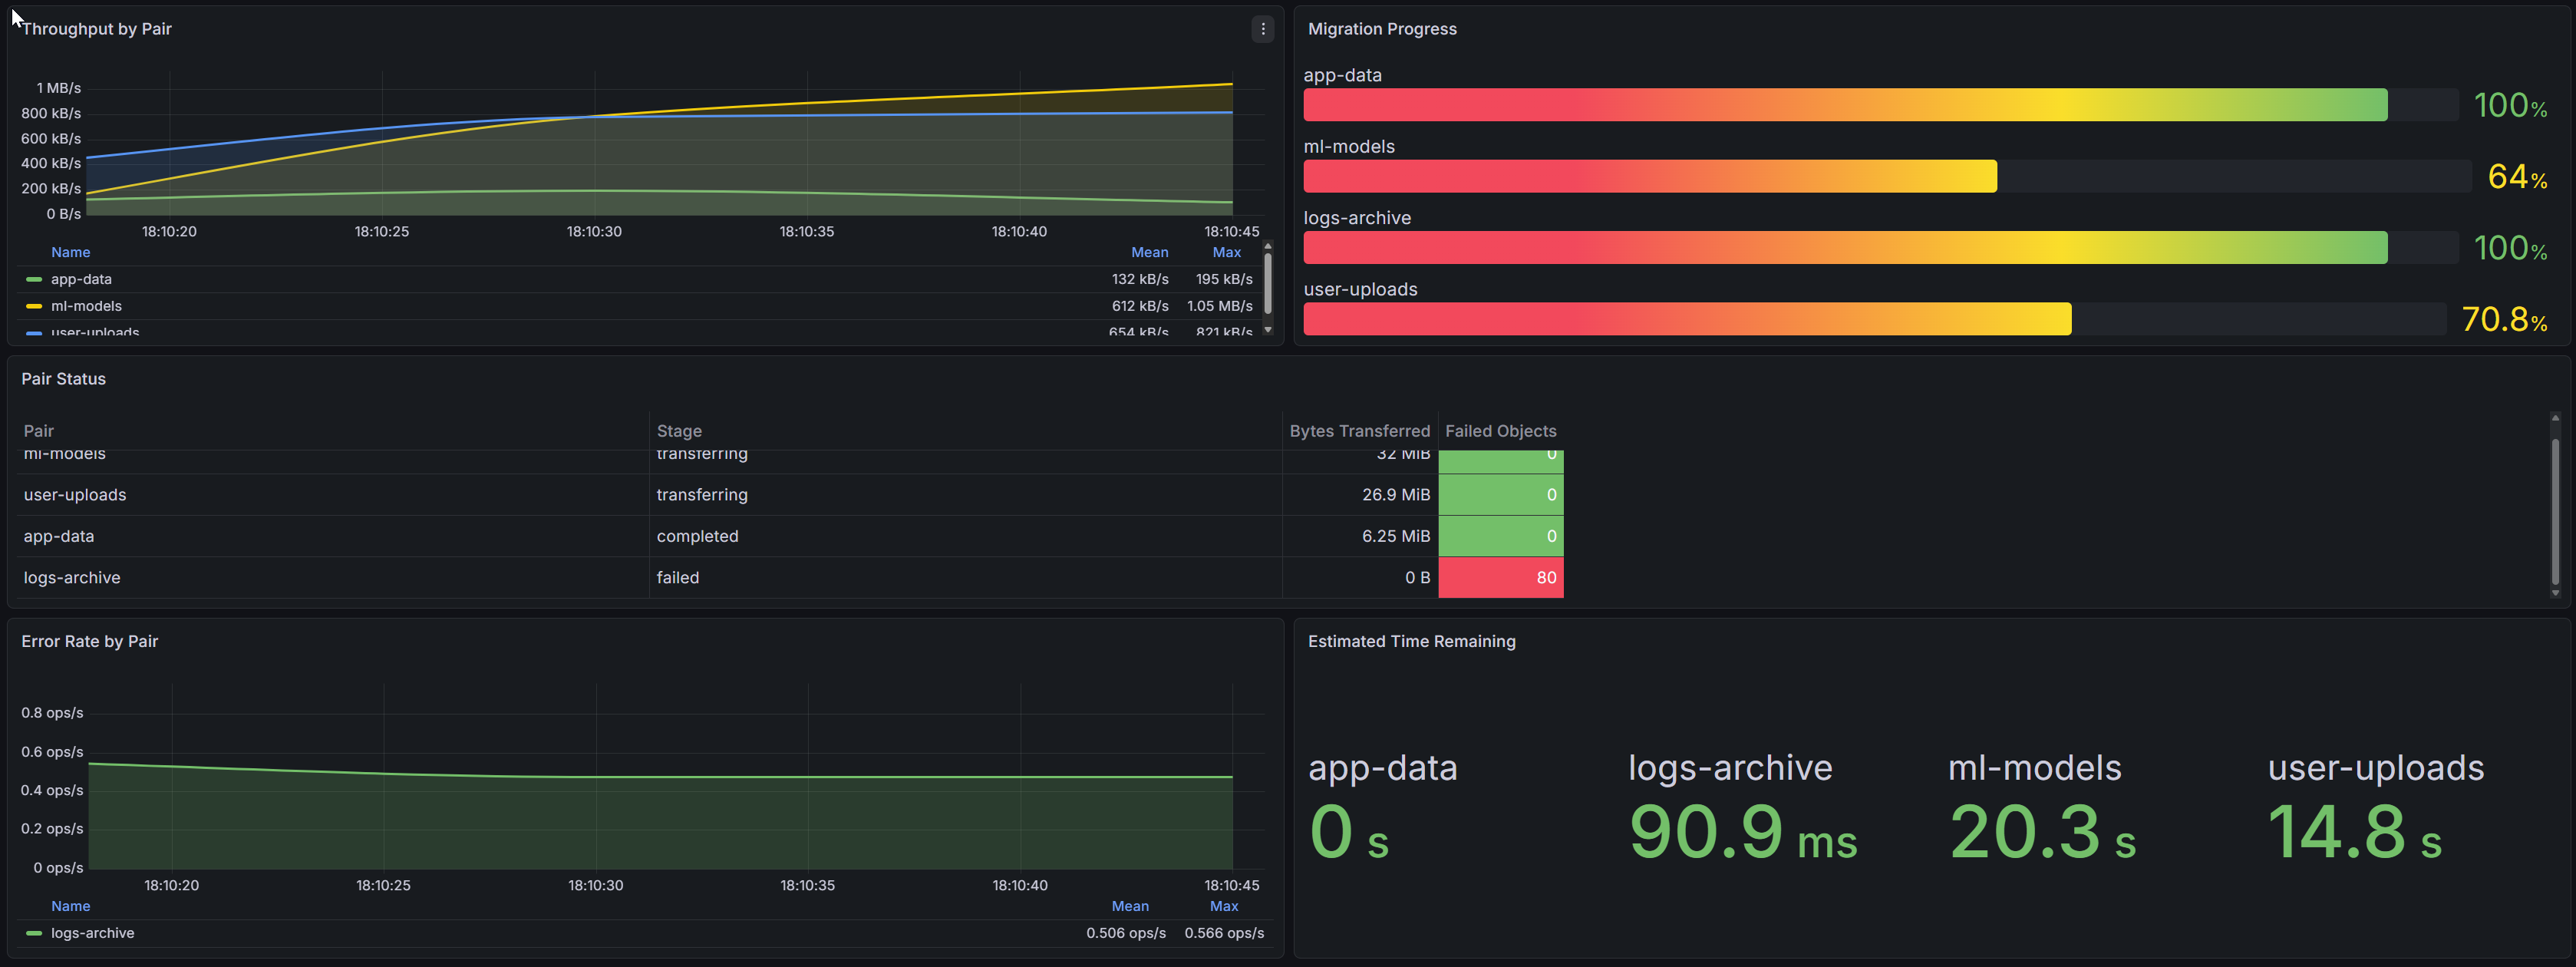
This dashboard is from the companion lab, which ships it pre-provisioned so you can see it live during the walkthrough.
Godwit exposes a wide set of Prometheus metrics. The lab dashboard uses 8 to keep things simple:
| Metric | Type | Purpose |
|---|---|---|
godwit_run_transfer_bytes_total |
Counter | Cumulative bytes; rate() gives per-pair throughput |
godwit_run_objects_completed |
Gauge | Objects finished per pair |
godwit_run_objects_total |
Gauge | Planned objects per pair |
godwit_run_objects_failed |
Gauge | Failed objects per pair |
godwit_run_bytes_transferred |
Gauge | Bytes moved per pair |
godwit_run_stage |
Gauge | Current phase: planning, transferring, verifying, completed, failed |
godwit_objects_total{status} |
Counter | Global objects by status; used for error rate |
godwit_eta_seconds |
Gauge | Estimated time to completion per pair |
These metrics drive five dashboard panels:
1. Throughput by Pair (time series). Four lines showing rate(godwit_run_transfer_bytes_total[15s]) grouped by pair. The lines diverge because each pair has different bandwidth limits. The app-data pair sustains higher throughput than logs-archive -- expected, given the different read_bps limits in their config files.
2. Migration Progress (bar gauge). Each bar represents godwit_run_objects_completed / godwit_run_objects_total for one pair. At a glance you see that ml-models is at 95% while logs-archive is at 12% -- expected, given the object counts.
3. Pair Status (table). Columns: Pair, Stage (from godwit_run_stage), Bytes Transferred (godwit_run_bytes_transferred), and Failed Objects (godwit_run_objects_failed). This is the single-pane summary an operator needs during the migration window.
4. Error Rate by Pair (time series). rate(godwit_objects_total{status="failed"}[1m]) grouped by pair. When logs-archive hits NoSuchBucket errors, this panel spikes for that pair while the other three stay flat. Immediate signal, no log parsing required.
5. Estimated Time Remaining (stat panel). godwit_eta_seconds per pair, displayed as human-readable remaining time. Operators see that app-data finishes in 8 minutes while logs-archive needs another 2 hours.
The Prometheus label scheme is simple: each scrape target corresponds to one port, and Prometheus relabeling adds a pair label from the target's port. No custom service discovery is needed.
Godwit exposes additional metrics covering multipart tracking, retry budgets, storage classes, and verification. See the full reference at /docs/prometheus.
For a walkthrough of the full 52-panel Grafana dashboard covering single-run deep dives, see Monitor S3 Migrations with Grafana.
Key Takeaways
Parallel Migration Uses One Process per Bucket Pair
Create one config file per source/destination bucket pair, then use an orchestrator script to spawn one godwit sync -f <file> process per pair. Each process runs independently with its own state database, resume point, and Prometheus metrics endpoint. The pattern works for any number of pairs.
A Failed Pair Does Not Affect Other Pairs
Only that pair stops. Every other pair continues unaffected because each runs as a separate process with its own SQLite state. Re-run the failed pair with --resume to pick up from the last successfully transferred object, not from the beginning.
One Grafana Dashboard Monitors All Pairs
Each Godwit process exposes Prometheus metrics on a separate port. Point Prometheus at all ports and build a single Grafana dashboard that groups panels by run_id. The companion lab ships a pre-built dashboard that shows throughput, progress, errors, and ETA for all pairs side by side.
Try It: Multi-Bucket S3 Migration Lab
The companion lab runs the entire workflow on your laptop in 15 minutes: two RustFS S3 endpoints (source with four pre-populated buckets, target empty), Prometheus, Grafana with a pre-provisioned dashboard, the config files, and the orchestrator script. You run all four pairs in parallel, watch per-pair progress in Grafana, see one pair fail due to an injected permission error, retry it, and verify all four.
Go to the Multi-Bucket Migration Lab
For a single-bucket walkthrough covering all three migration directions (upload, transfer, download), start with the S3 Migration Guide.