Monitor S3 Migrations in Real Time with Godwit Sync, Prometheus, and Grafana
Track S3 migration progress, throughput, latency, multipart uploads, retries, and verification in real time with Godwit Sync's built-in Prometheus metrics and a pre-built Grafana dashboard.
Hands-on lab available. The companion lab runs every example from this article against real MinIO infrastructure with a pre-provisioned Grafana dashboard and Prometheus.
S3 Migrations Need Observability Beyond Terminal Output
Terminal output and log files do not survive CI pipelines, do not support alerting, and require custom parsing to extract anything quantitative. Most S3-compatible servers already expose Prometheus metrics, so teams have Grafana dashboards for storage health. Godwit Sync adds the missing client side -- transfer progress, throughput, retries, and errors -- into the same Prometheus instance, so server-side and client-side metrics share the same datasource and can be correlated in a single Grafana dashboard. Run-level metrics carry a run_id label, so concurrent or sequential Godwit runs are distinguishable without extra configuration.
Metrics solve these problems:
- Silent failures. A sync process can exit successfully while individual objects fail to transfer. A failed-object counter makes partial transfers impossible to miss.
- No transfer progress. Scrolling filenames in a terminal do not tell you how far along a migration is. Object and byte counters show exact completion state at any point during the run, from any machine on the network.
- Stalled vs. slow is indistinguishable. A transfer hanging on one large object produces no output. Throughput time series make the difference between "slow" and "stuck" obvious and let you set alerts on zero-throughput windows.
- Blind capacity planning. Without historical throughput data, teams cannot forecast how long nightly syncs will take as data grows. Bytes-per-second time series recorded in Prometheus expose network saturation, storage throttling, and rate-limit ceilings over weeks or months.
- Wasted bytes from failed multipart uploads. When a multipart upload fails partway through, the parts already written consume storage and bandwidth for nothing. Multipart session and wasted-byte counters quantify the cost.
- Retry storms are invisible. Internal retries can exhaust silently, giving up on objects without surfacing a summary. Retry counters separated by direction (read vs. write) pinpoint the problematic storage endpoint.
- No ETA. Estimated time remaining derived from actual transfer rates updates continuously. Operators and stakeholders can see whether a migration will finish inside the maintenance window.
- Logs vanish after exit. Terminal output does not survive process termination. Prometheus retains metrics after the process exits, so throughput patterns, retry spikes, and latency distributions stay available for post-mortem analysis without scraping logs.
Godwit Sync Serves Prometheus Metrics on Every Run
--status-addr :9091 starts an HTTP server alongside any godwit sync transfer on port 9091:
/metricsreturns Prometheus exposition format text, ready for scraping./statusreturns JSON for programmatic polling or custom integrations.
After the sync completes, the server stays alive for --drain-timeout seconds (default: 15) so Prometheus can scrape the final values before the process exits.
The metrics cover six categories:
| Category | Key Metrics | What They Track |
|---|---|---|
| Progress | godwit_objects, godwit_bytes |
Object and byte counts by state (total, done, failed, pending, running) |
| Performance | godwit_throughput_bytes_per_second, godwit_task_duration_seconds |
Real-time throughput and per-object transfer latency histograms |
| Multipart | godwit_multipart_sessions_total, godwit_multipart_parts_total |
Multipart upload sessions (created, resumed, aborted) and parts |
| Errors & Retries | godwit_retries_total, godwit_partial_upload_wasted_bytes_total |
Retry counts by direction, bytes lost to failed partial uploads |
| Run Lifecycle | godwit_run_stage, godwit_run_objects_completed |
Per-run stage tracking, progress, start and completion timestamps |
| Runtime | go_goroutines, process_resident_memory_bytes |
Go runtime and OS process health |
A curl localhost:9091/metrics during a transfer returns lines like:
godwit_objects{state="done"} 6040
godwit_objects{state="total"} 12500
godwit_throughput_bytes_per_second 5242880
godwit_eta_seconds 55
godwit_run_stage{run_id="migrate",stage="transferring"} 1
Point Prometheus at this endpoint and Grafana renders the data automatically.
Grafana Dashboard for Godwit Sync Migrations
Godwit Sync ships a ready-to-use Grafana dashboard with 52 panels organized into nine rows. Each row focuses on a different aspect of the migration. Import the dashboard JSON, configure the Prometheus datasource, and every metric described below appears automatically.
Transfer Overview
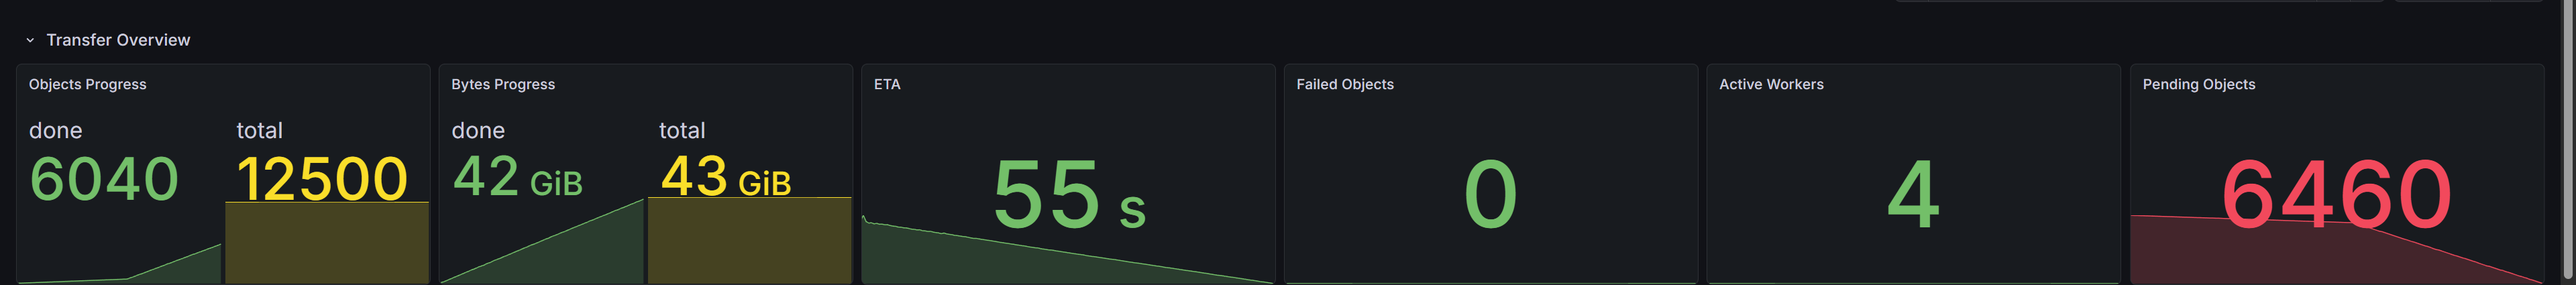
The top row gives an at-a-glance summary. Objects Progress and Bytes Progress show transferred counts against the total. ETA displays the estimated time remaining, updating as throughput changes. Failed Objects stays at zero in a healthy migration. Any non-zero value indicates an issue. Active Workers shows parallel transfer goroutines currently busy. Pending Objects shows queue depth, which drains to zero by completion.
Throughput and Latency
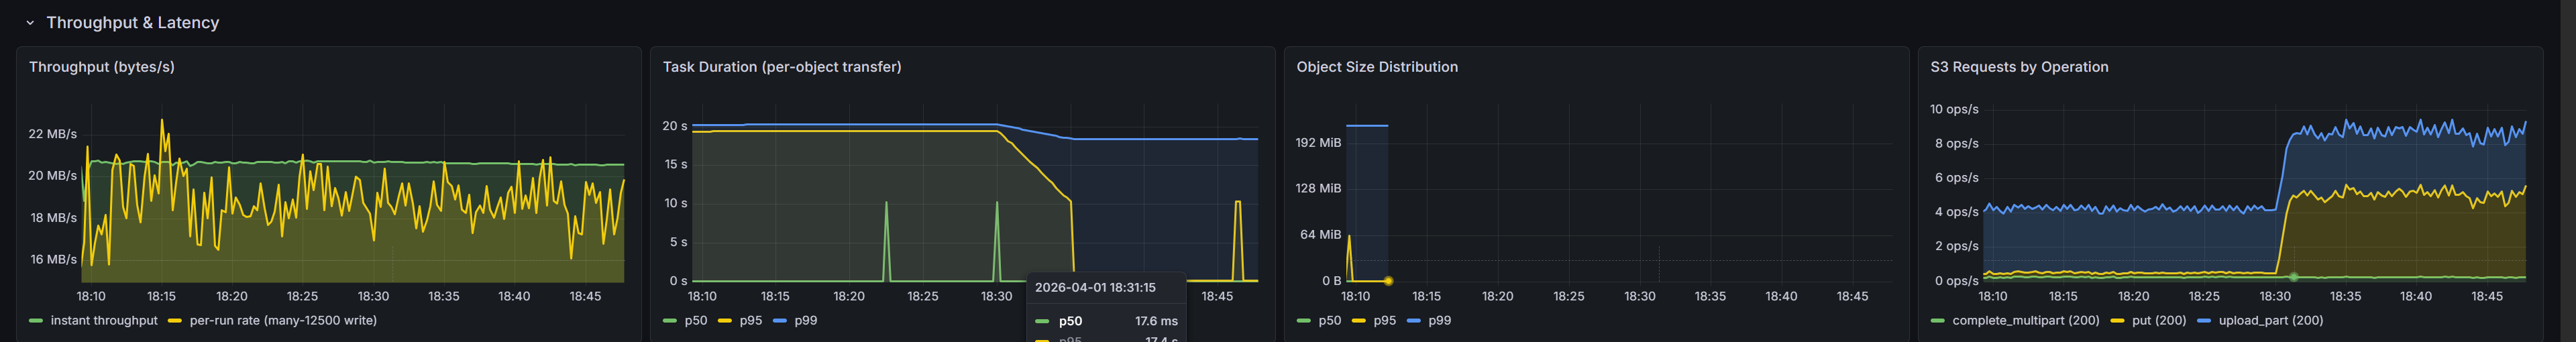
Throughput (bytes/s) plots the sustained transfer rate over time. Drops indicate network congestion, storage throttling, or rate-limit changes between rounds. Task Duration breaks per-object transfer time into p50, p95, and p99 percentiles, making tail latency visible. Object Size Distribution reveals the size profile of planned objects -- many small objects produce different throughput patterns than fewer large ones. S3 Requests by Operation counts API calls by type (GET, PUT, complete_multipart), useful for spotting unexpected request patterns.
Object and Byte Breakdown
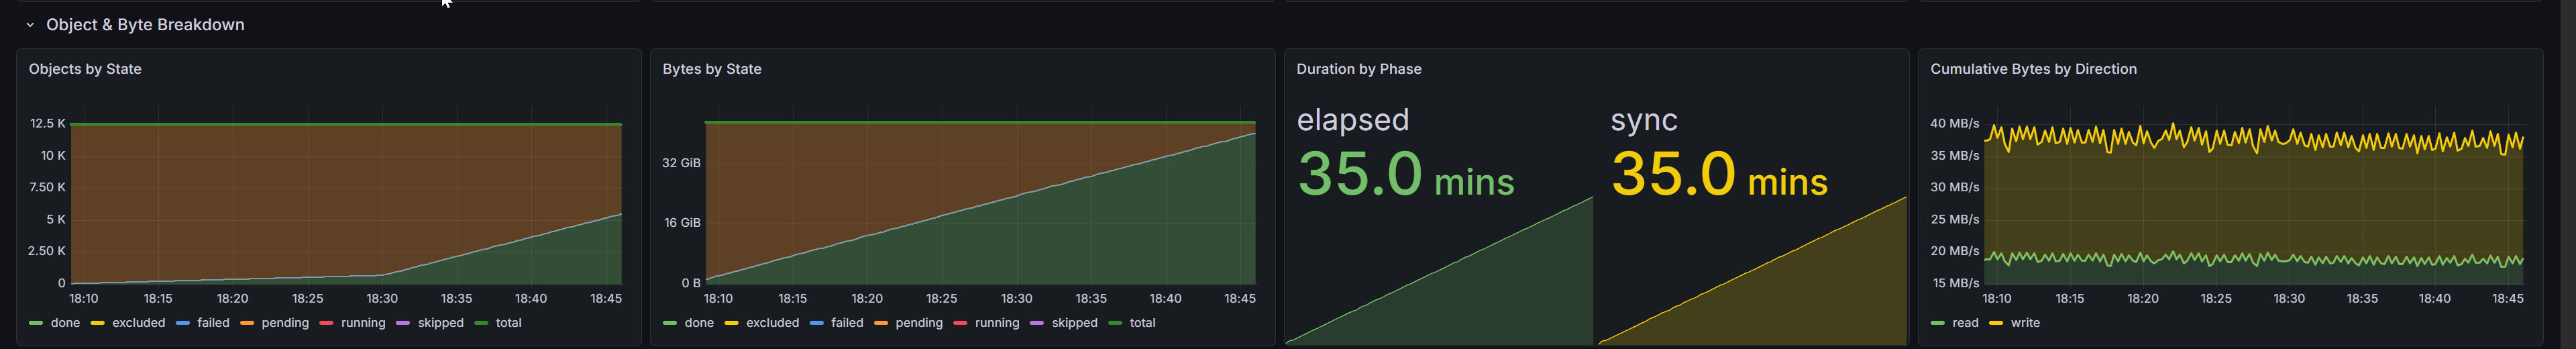
Stacked area charts show objects and bytes moving through states over time. Objects by State and Bytes by State visualize the transition from pending through running to done, with failed objects highlighted. Duration by Phase shows elapsed wall-clock time and sync time side by side. Cumulative Bytes by Direction separates read and write byte rates -- useful for s3-to-s3 migrations where source reads and destination writes have different throughput characteristics.
Multipart Uploads and Upload Type
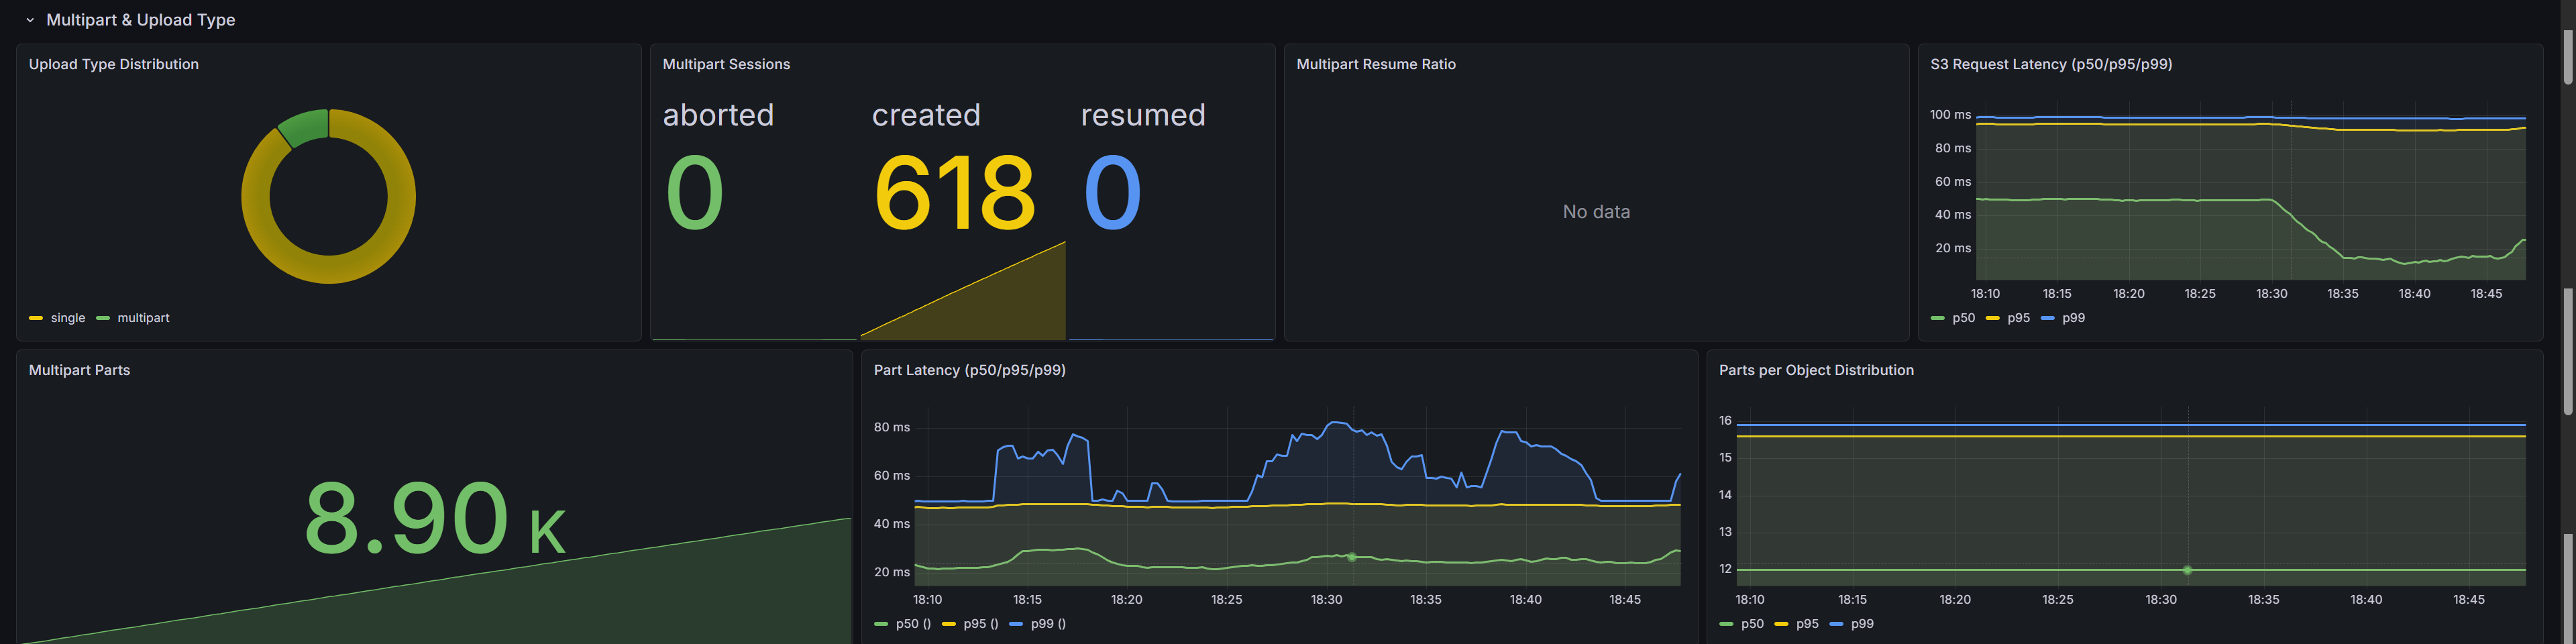
Large objects are uploaded in parts. Upload Type Distribution shows the split between single-put and multipart uploads as a donut chart. Multipart Sessions counts sessions created, resumed, and aborted. Multipart Resume Ratio calculates the fraction of resumed sessions -- a high ratio means the transfer picks up where a previous run left off instead of re-uploading from scratch.
S3 Request Latency shows raw S3 API call latency at p50/p95/p99. Multipart Parts tracks parts uploaded versus skipped. Part Latency shows per-part upload and download latency. Parts per Object reveals the part count for large objects, which depends on --part-size.
Errors, Retries, and Verification
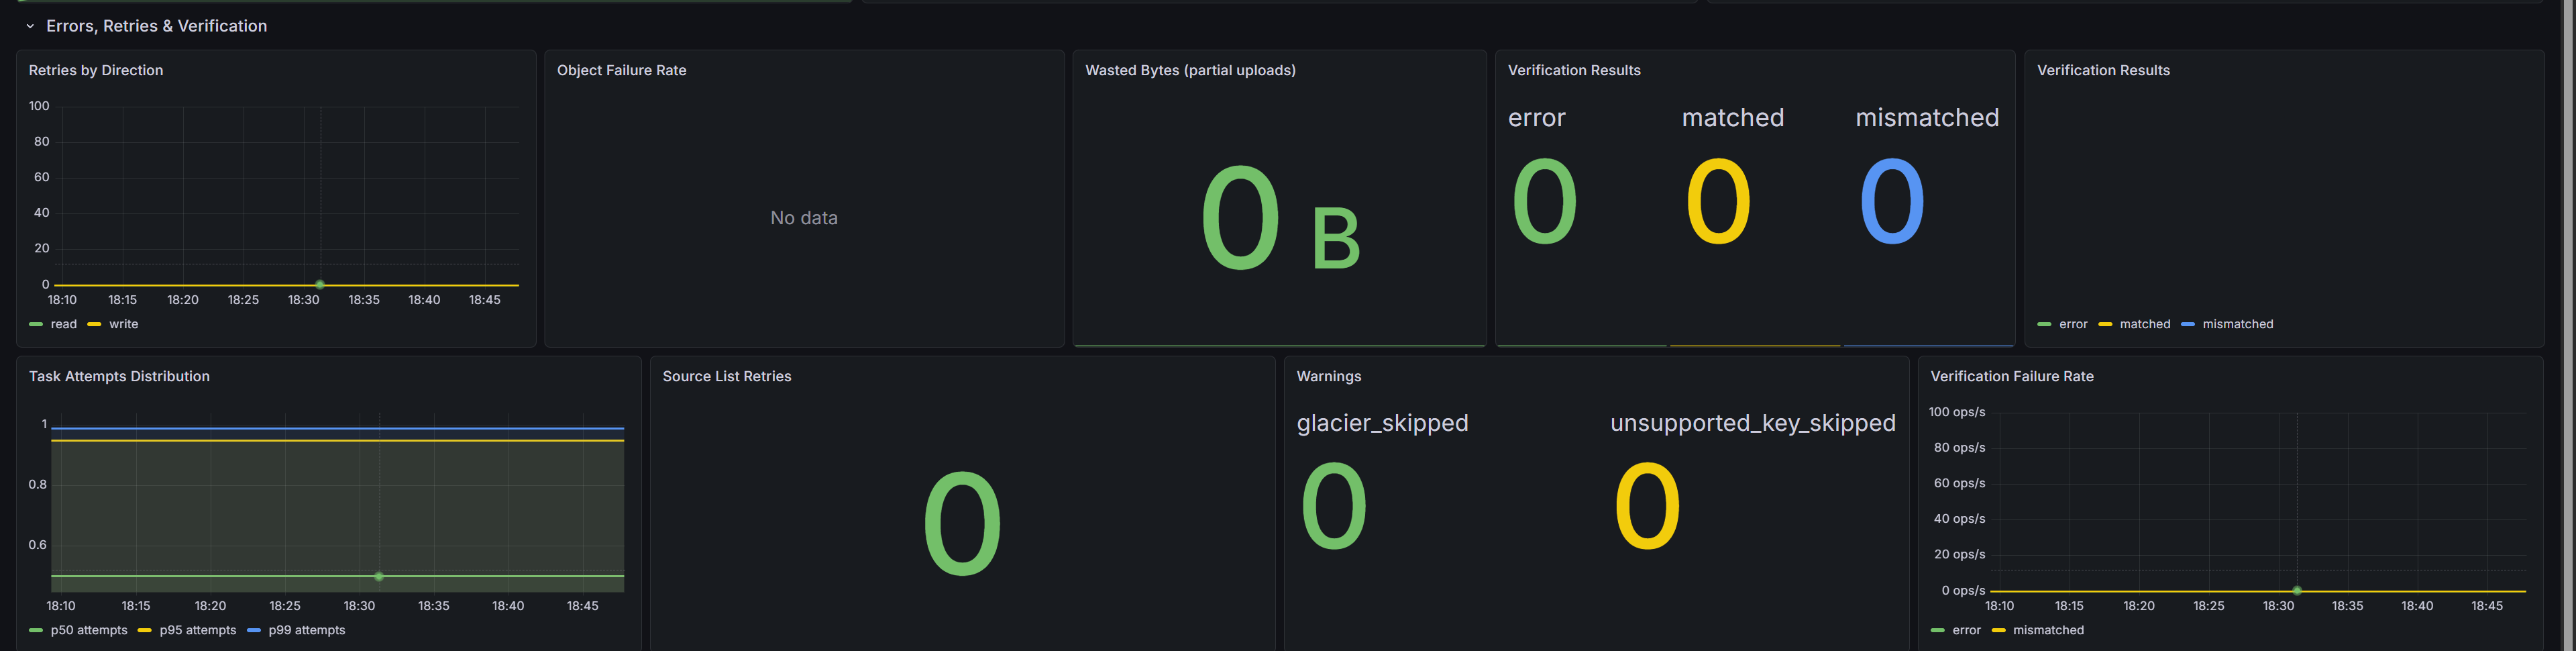
Retries by Direction separates read retries from write retries -- a spike on one side points to the problematic storage endpoint. Object Failure Rate tracks permanently failed objects over a rolling window. Wasted Bytes counts bytes uploaded in parts that were discarded due to a failed upload, quantifying the cost of retries.
Verification Results shows post-transfer checksum outcomes: matched, mismatched, or error. Task Attempts Distribution reveals attempt counts per object. Source List Retries counts retries during the initial bucket listing. Warnings surfaces non-fatal conditions such as skipped Glacier objects or unsupported key types.
Per-Run Details
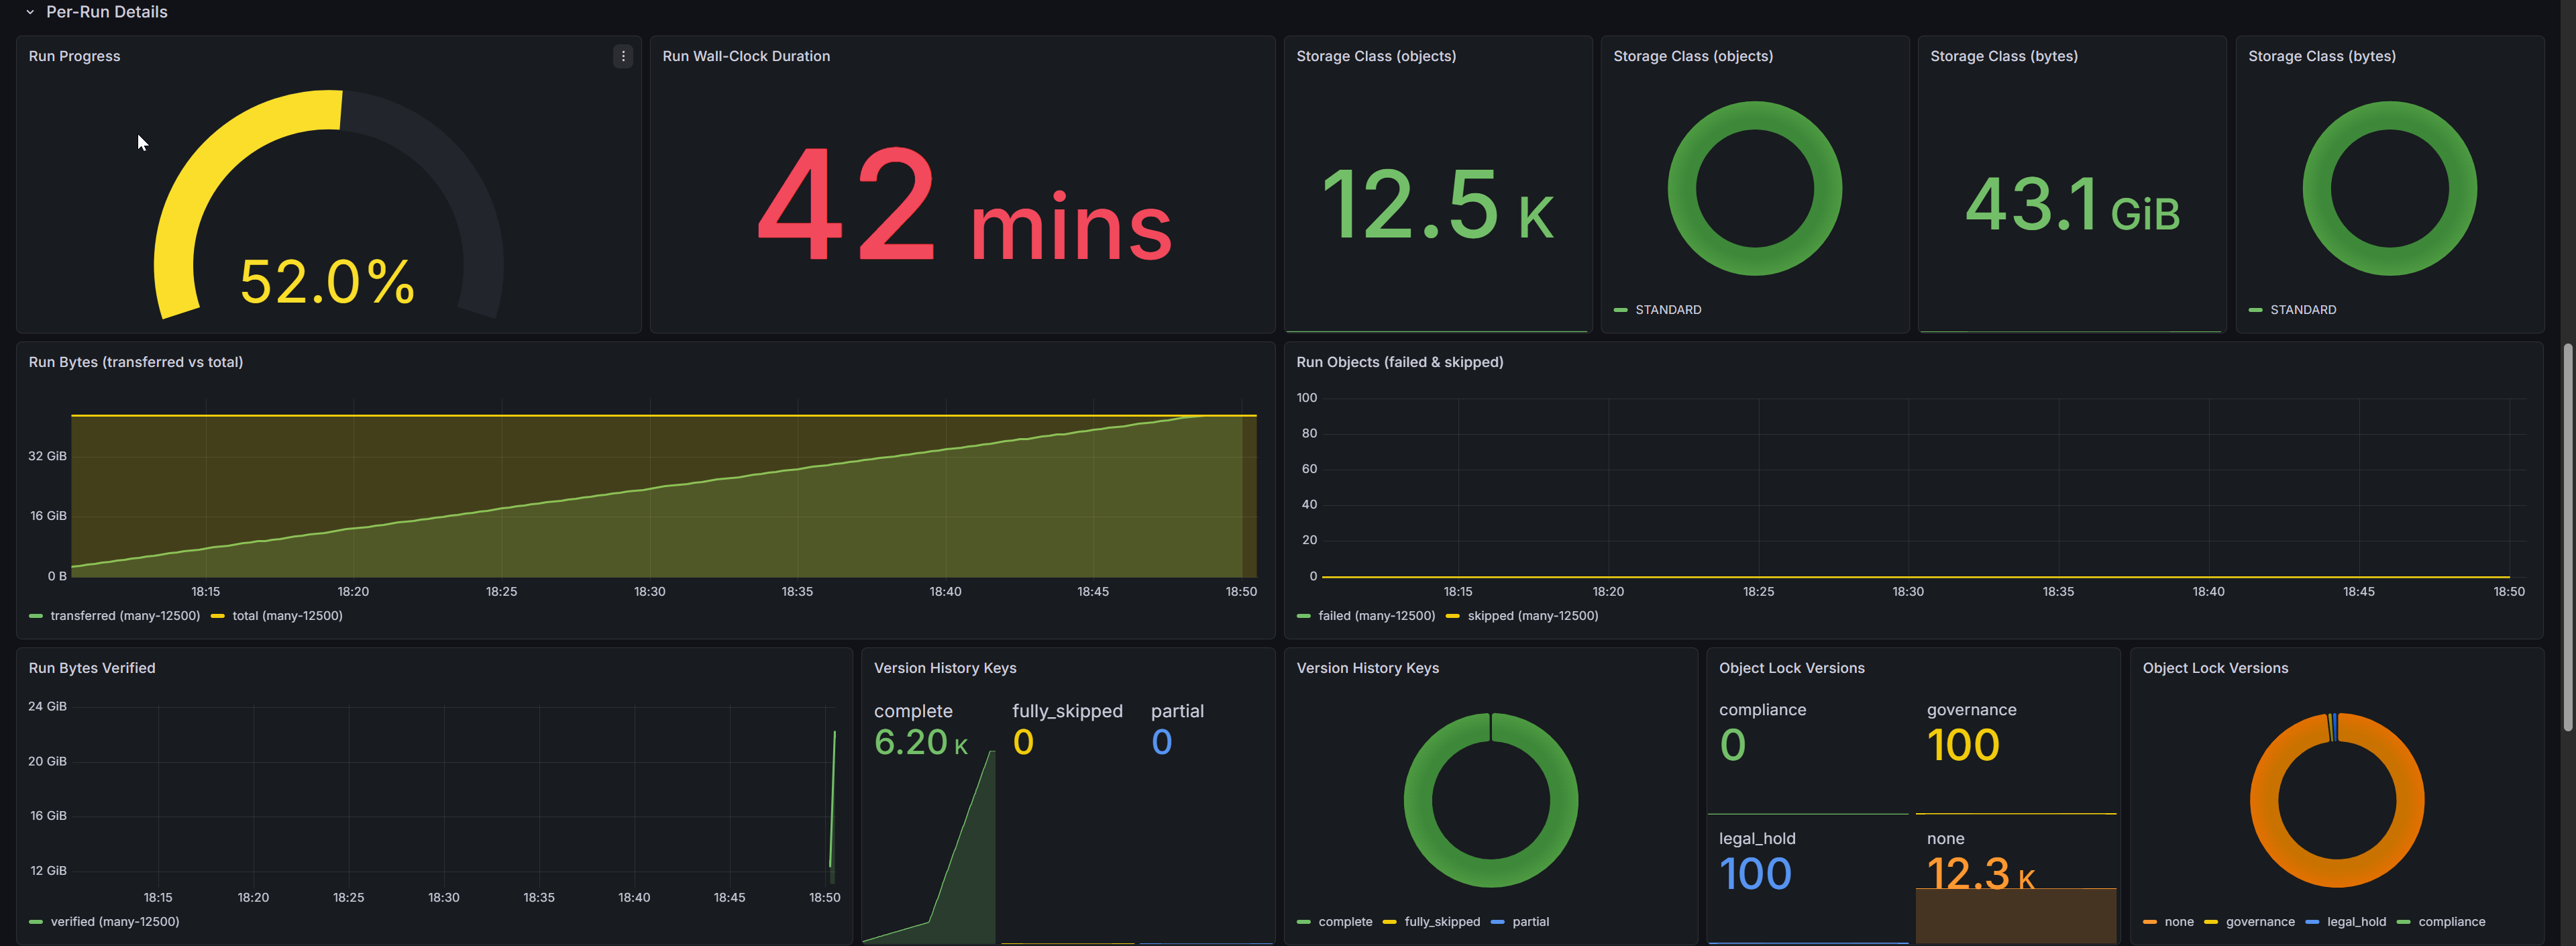
Migrations with multiple runs (separate hops for fs-to-s3, s3-to-s3, and s3-to-fs) get individual tracking here. Run Progress shows a per-run completion gauge. Run Wall-Clock Duration displays elapsed time per run. Storage Class panels break down objects and bytes by S3 storage class (STANDARD, GLACIER, etc.).
Run Bytes Transferred vs Total and Run Objects Failed/Skipped give per-run transfer accounting. Run Bytes Verified tracks bytes verified after transfer. Version History Keys shows per-key completeness for versioned migrations (complete, partial, skipped). Object Lock Versions breaks down versions by lock type (GOVERNANCE, COMPLIANCE, legal hold).
Verification Progress
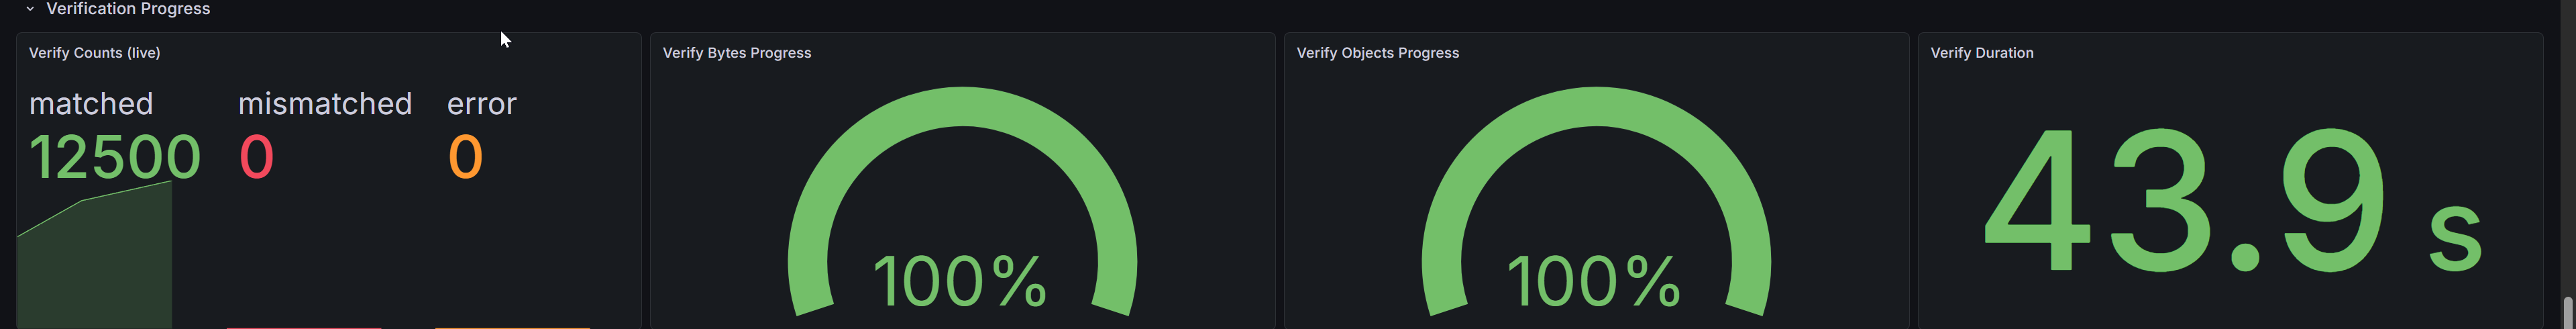
godwit plan verify re-reads destination objects and validates checksums against the source. Verify Counts shows running totals for matched, mismatched, and error results. Verify Bytes Progress and Verify Objects Progress display gauge-style completion percentages. Verify Duration shows elapsed verification time. These panels populate during or shortly after a verify run.
Configuration
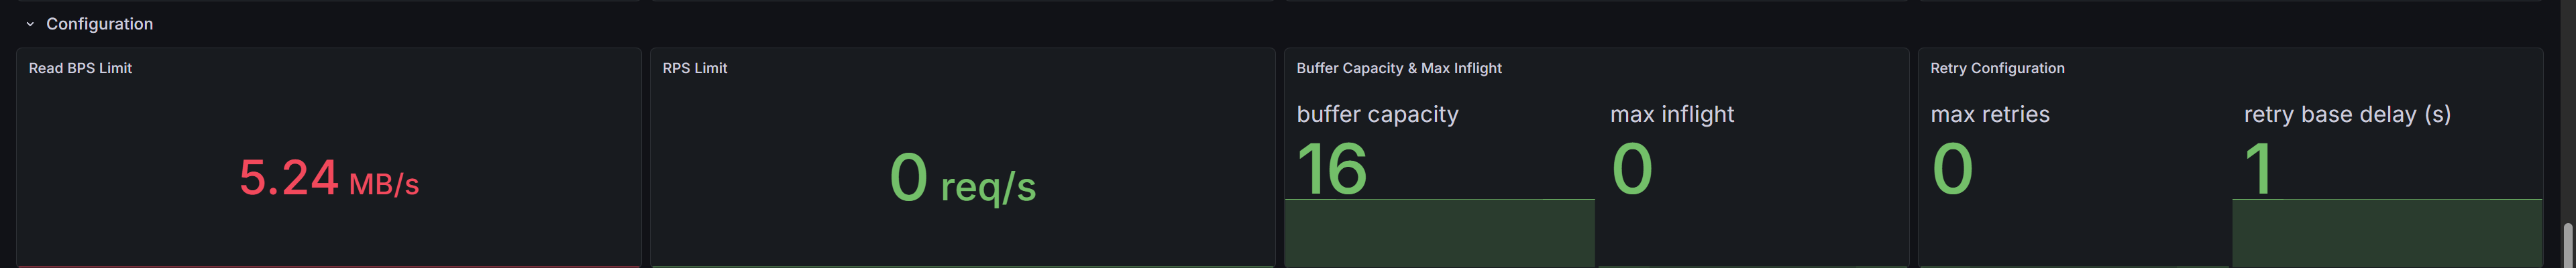
Read BPS Limit shows the throttle value from --read-bps. RPS Limit shows the requests-per-second cap (0 means unlimited). Buffer Capacity and Max Inflight display queue sizing and concurrency limits. Retry Configuration shows maximum retry count and base delay. These panels correlate performance with configuration -- confirming that a throughput plateau matches a rate limit, not a storage bottleneck.
Go Runtime
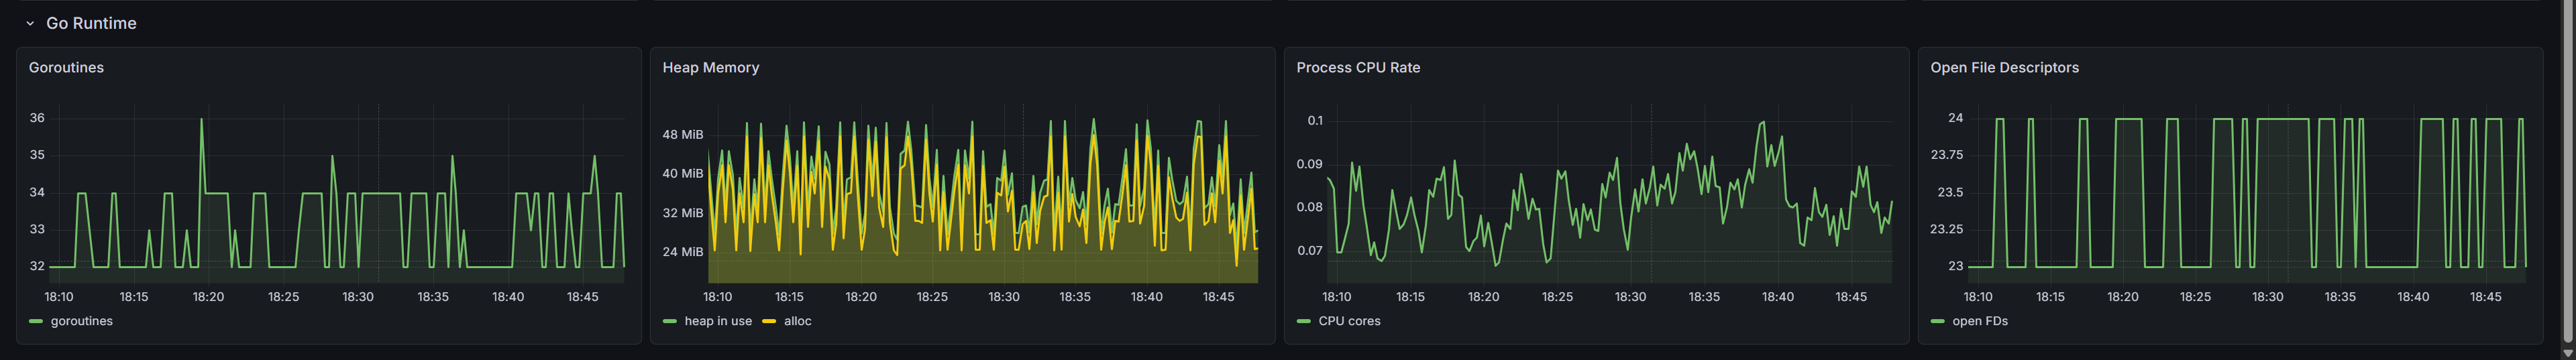
Goroutines should remain stable; a continuous upward trend suggests a leak. Heap Memory tracks allocation and in-use heap size. Process CPU Rate shows CPU consumption over time. Open File Descriptors matters at high concurrency, since each parallel transfer and S3 connection consumes file descriptors.
Key PromQL Queries
The most useful queries for ad-hoc exploration or custom panels:
# Transfer progress percentage
godwit_objects{state="done"} / godwit_objects{state="total"} * 100

# Current throughput
godwit_throughput_bytes_per_second

# Failure rate (objects per second)
rate(godwit_objects_total{status="failed"}[5m])

# p99 per-object transfer duration
histogram_quantile(0.99, rate(godwit_task_duration_seconds_bucket[5m]))

# Per-run byte throughput
rate(godwit_run_transfer_bytes_total[1m])

# Run progress percentage
godwit_run_objects_completed / godwit_run_objects_total * 100

# Multipart resume ratio
godwit_multipart_sessions_total{action="resumed"}
  / (godwit_multipart_sessions_total{action="created"}
   + godwit_multipart_sessions_total{action="resumed"})
Try It Hands-On
The companion lab runs the full observability stack locally with Docker Compose: two MinIO instances, Prometheus pre-configured to scrape Godwit Sync, and a pre-provisioned Grafana dashboard. Follow the lab README for step-by-step instructions.